Contents:
Learn: Mathematics for Data Science
Learn moreWhat is a graph
A graph is a mathematical structure designed to model the relationships between different objects. It consists of vertices and the edges that connect these vertices. Graphs are widely used in various fields, such as computer science, social sciences, and biology, to analyze and visualize relationships and interactions. Using graphs allows you to effectively solve problems related to pathfinding, optimization, and data clustering.
Graphs are best understood through a concrete example. Consider three cities with simple names A, B, and C, which are connected by roads: AB, AC, and BC. Visually, this can be represented as a graph, where the cities are the vertices, and the roads are the edges connecting these vertices. This approach allows us to clearly see how graphs function and how they can be used to model various systems and relationships in the real world.
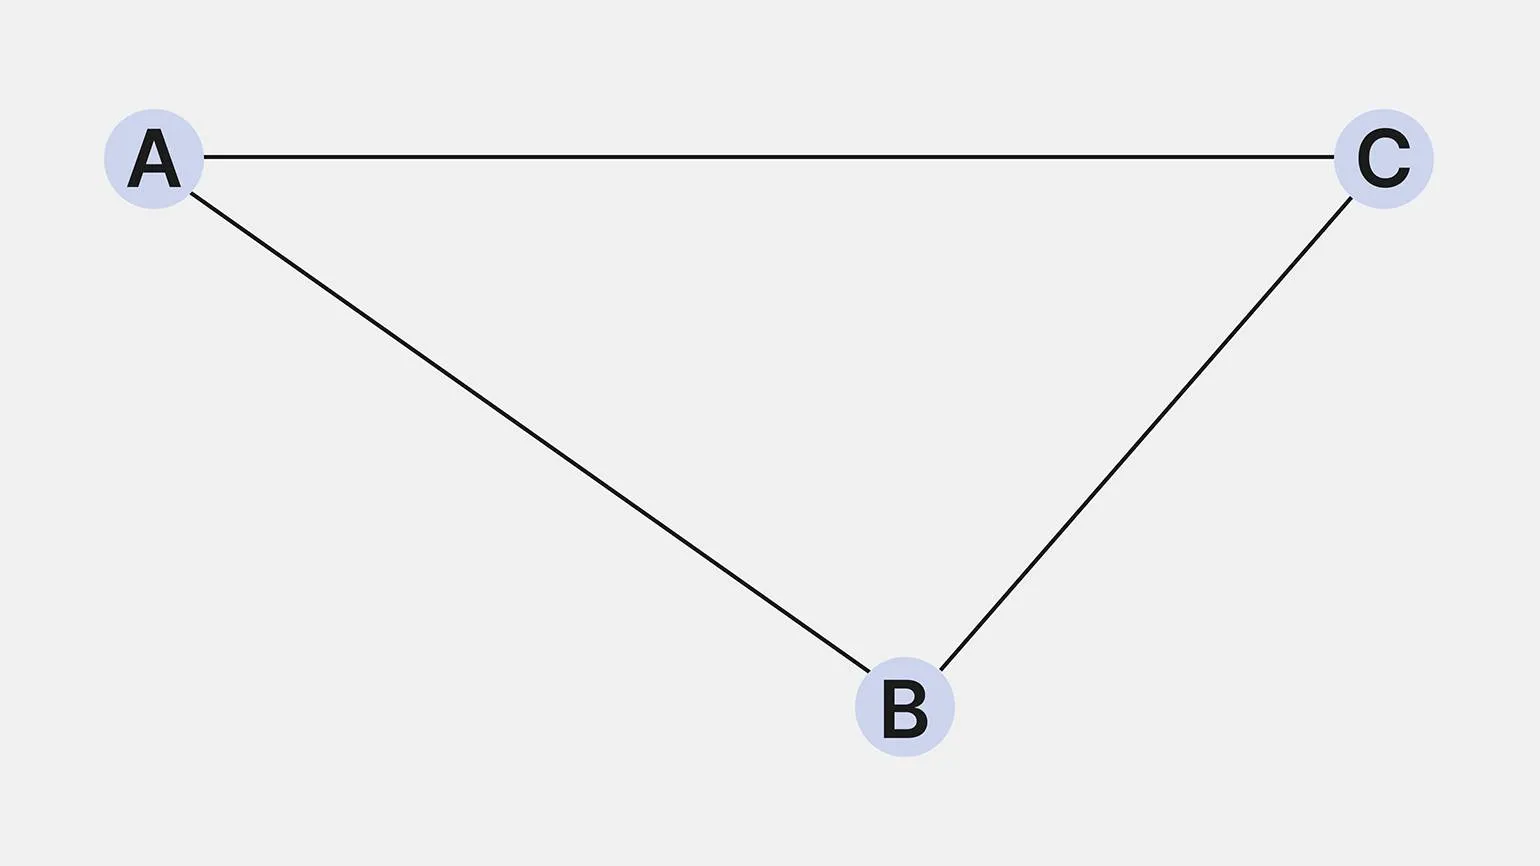
The resulting figure is a graph that includes A graph consists of several key elements. A graph consists of nodes and edges, where nodes represent objects, or vertices, and edges represent the connections between them. These elements interact with each other to form a structure that allows data to be analyzed and visualized. Graphs are widely used in a variety of fields, including mathematics, computer science, and the social sciences, to model complex systems and identify patterns.
- Vertices. Key points or objects in a graph. These could be, for example, cities on a map, web pages on the internet, or departments in a company.
- Edges. Lines that connect vertices. For example, a road between two cities, a hyperlink between web pages, or interactions between departments in a company.
Graphs are effective at displaying complex relationships that are not amenable to other visualization methods. For example, a graph can be used to create a social network map, where vertices represent people and edges illustrate their relationships. This approach allows us to visually see the structure and dynamics of social interactions, which makes graphs an indispensable tool in the analysis and study of social networks.
Basic Concepts of Graph Theory
In graphs, edges and vertices can establish various types of connections, which provides flexibility in modeling the relationships between objects. This allows for more accurate and visual display of useful information in graphical representations. The diversity of connections in graphs contributes to a better understanding of the structure of the data and their relationships.
An edge that connects two vertices is called incident to these vertices. For example, edge AB connects vertices A and B, and, therefore, it is incident to both vertex A and vertex B. Incidence is a relationship that exists exclusively between a vertex and an edge; two vertices or two edges cannot be incident to each other. Understanding incidence is important for studying graphs and their structure, as it defines the relationships between graph elements and aids in analyzing its properties.
Edges in graphs can be directed or undirected. An undirected edge exists between vertices A and B if it is possible to travel from A to B and back. An example of an undirected edge is a road between cities A and B, which allows travel in either direction. Thus, an undirected edge connects vertices A and B, providing a connection between them.
If it is possible to travel from point A to point B, but the return path is not possible, then the connection between them is directed from A to B. Undirected links can illustrate not only transport routes between cities, but also relationships in social networks. For example, if a user follows another user, but the latter does not follow back, such a connection is considered undirected.
Graphs are classified by edge direction. If all edges have a direction, then such a graph is called directed or oriented. When edges have no direction, the graph is called undirected or unoriented. If a graph contains both directed and undirected edges, it is classified as a mixed graph. Understanding these categories of graphs is important for analyzing structures and algorithms in various fields such as computer science, mathematics, and networks.

Loop, also A loop, also known as a cycle, is a unique type of edge that begins and ends at the same vertex. In the context of social media, a loop might, for example, represent a situation where a user sends a message to themselves. If a graph lacks loops, it is classified as acyclic. Acyclic graphs are important in various fields, including computer science and graph theory, as they provide a simpler structure for analyzing and processing data.
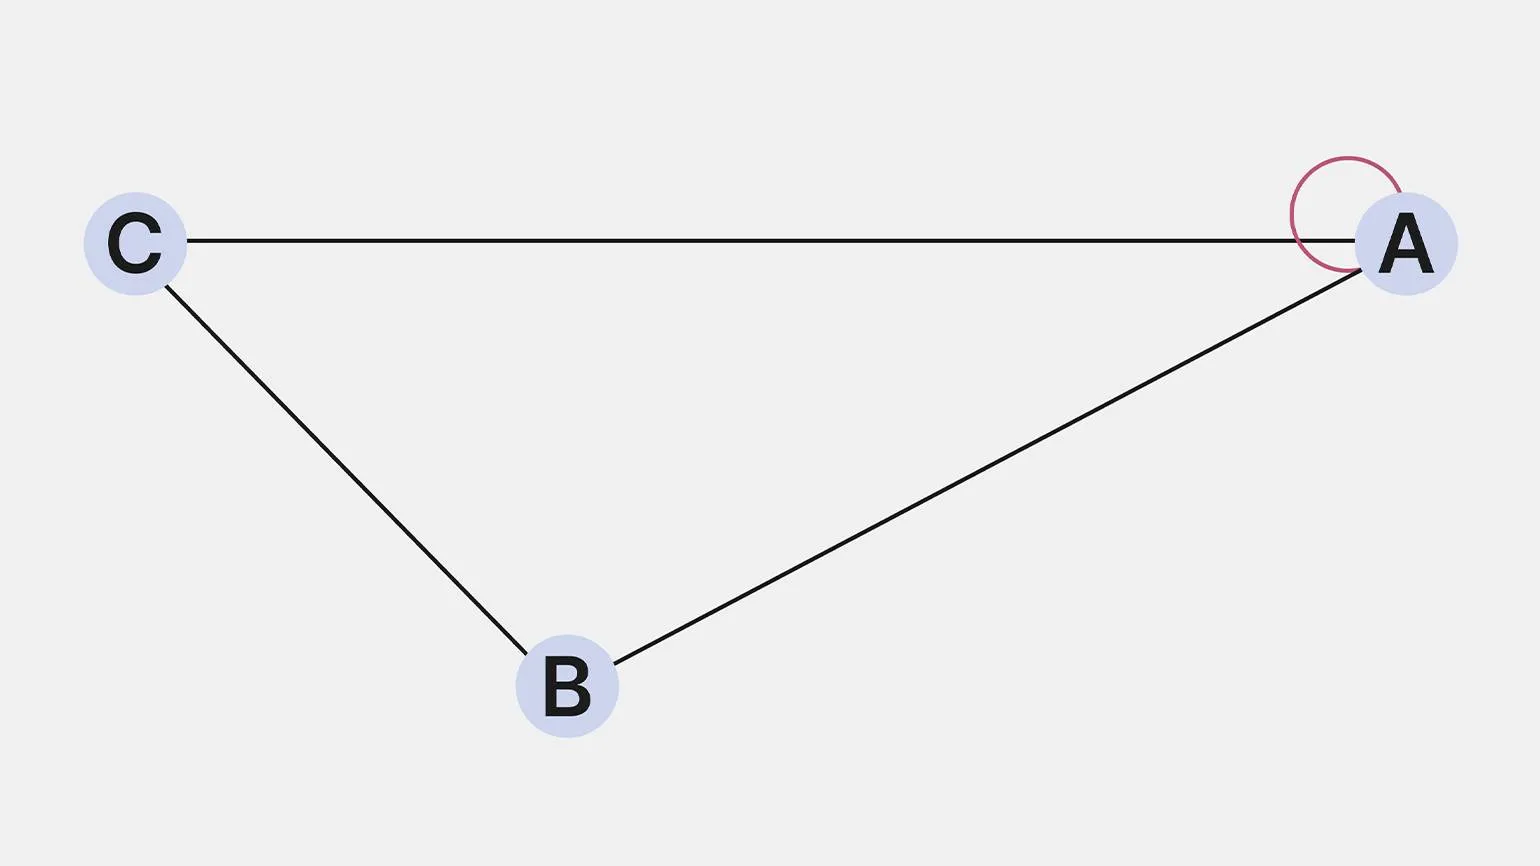
Graph vertices have unique properties that play a key role in graph theory. Each vertex can be connected to other vertices via edges, which determines the graph's structure. Vertices can have various attributes, such as degree, which indicates the number of edges connecting a given vertex to others. It's also important to consider that vertices can be classified by type—for example, in directed graphs, they can be source or destination vertices. These characteristics allow us to analyze graphs, identify their features, and apply them to various fields, such as computer science, social networks, and transportation systems. Understanding the properties of graph vertices is the basis for a deeper study of their interactions and their application to practical problems.
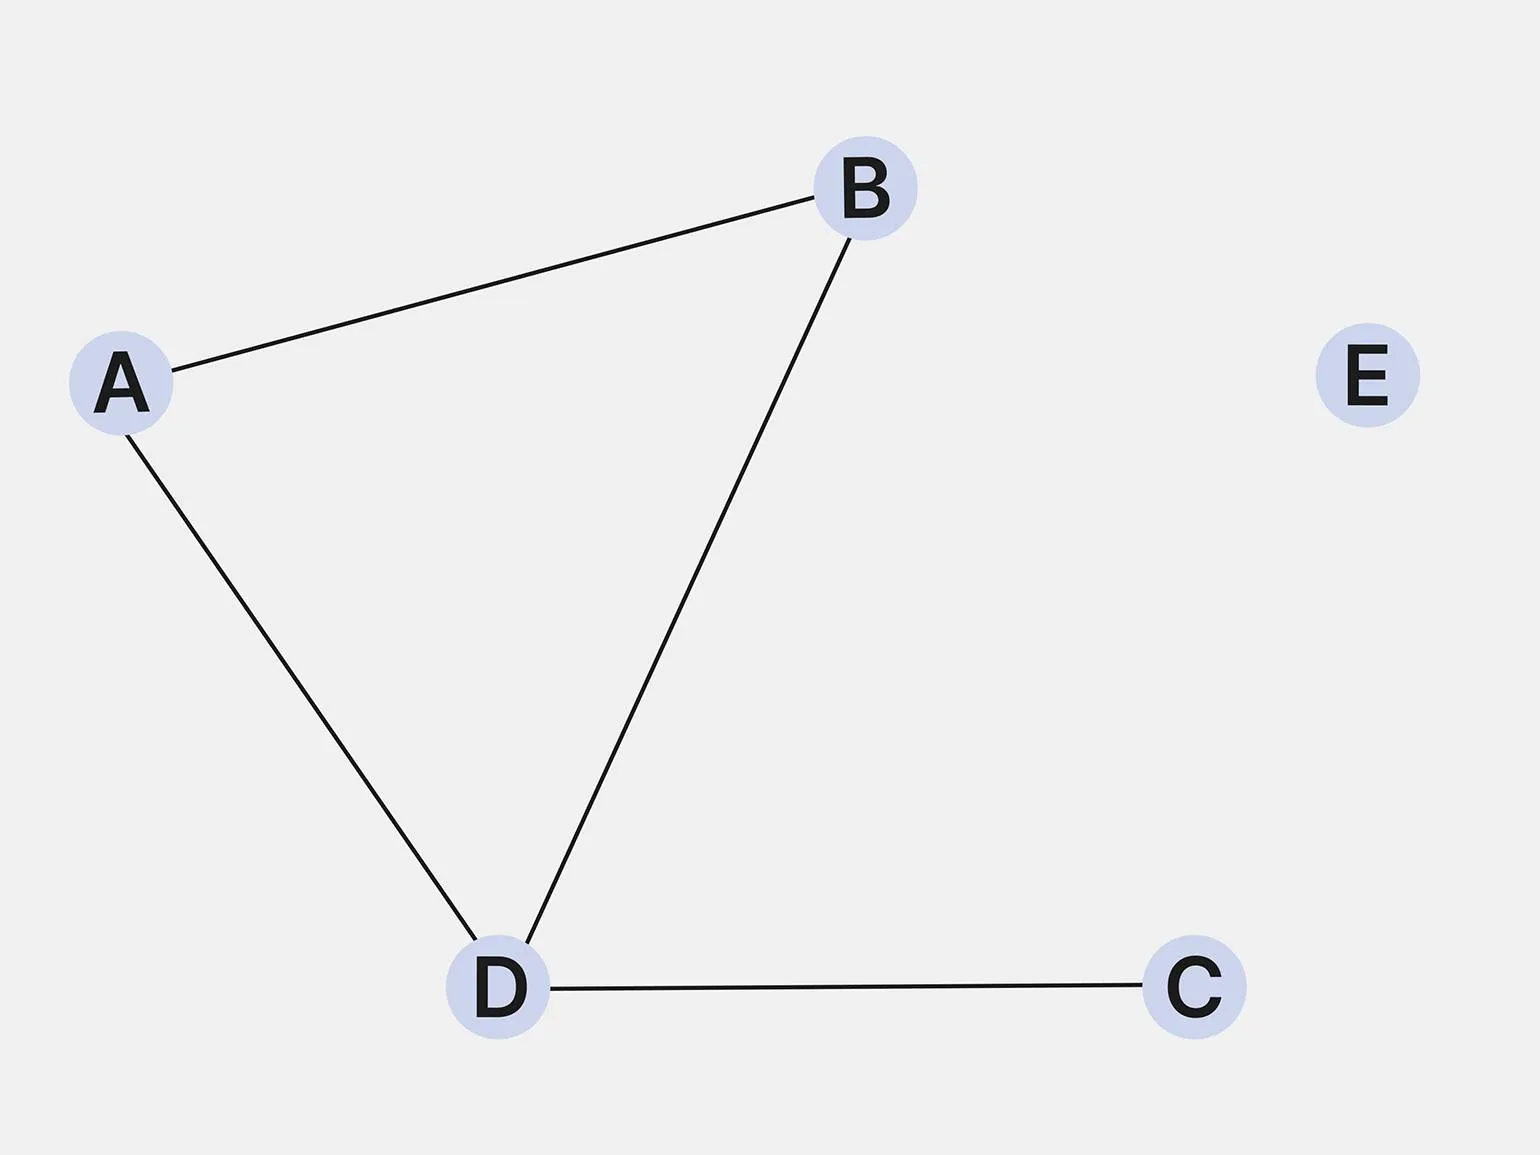
- If two vertices are connected by an edge, they are called adjacent.
- A vertex without incident edges is an isolated vertex.
- If a vertex has only one connection to other objects in the graph, it is called a pendant vertex.
- The degree of a vertex is the number of edges that extend from it.
Path, Chain, and Cycle in a Graph
In graph theory, the concepts of path, chain, and cycle represent the main ways of moving between vertices of a graph. A path is a sequence of vertices in which every pair of adjacent vertices is connected by an edge. A chain, in turn, can include repeated vertices and edges, which makes it more flexible in use. A cycle is a special type of path that returns to the starting vertex, forming a closed circuit. These concepts play a key role in solving problems related to finding optimal routes and modeling complex interconnected systems. Understanding these fundamental elements of graph theory allows for the effective analysis and optimization of networks, which finds application in various fields, from logistics to computer science.
Graph routes include several key types, each with its own characteristics and applications. The main categories of graph routes can be distinguished as simple, cyclic, shortest, and optimal.
Simple routes are sequences of edges that do not contain repeated vertices. Cyclic routes, in turn, begin and end at the same point, forming a closed circuit. Shortest routes focus on minimizing the total length or weight, making them relevant for optimization problems. Optimal routes can take into account various criteria, such as time, cost, or other parameters. Understanding the different types of routes in graphs is important in fields such as logistics, transportation, computer science, and networking. This knowledge helps plan routes efficiently, reducing costs and improving performance. A path is a finite or infinite sequence of vertices and edges in which the end of one edge is the beginning of the next. A chain is a sequence of edges in which each edge is connected to the next via a common vertex. A chain can repeat vertices, but not edges. A cycle is a special case of a path that begins and ends at the same vertex. In this case, all edges and vertices (except the start and end) are unique. An important condition for a cycle: you must not traverse the same edge twice.
Types of Graphs
There are many types of graphs, each of which effectively demonstrates different relationships between objects. Graphs are a powerful tool for visualizing data and analyzing relationships, allowing for a better understanding of the structure and dynamics of systems. Different types of graphs, such as directed, undirected, weighted, and unweighted, are applied in various fields, from social networks to scientific research, providing a deep understanding of inter-object interactions.
- Directed. A graph in which each edge indicates its direction using arrows that can be followed. For example, when there is a path A → B → C, but no reverse edges; it is impossible to return from C to A.
- Undirected. A graph in which the edges do not indicate a direction. This means that from any vertex you can get to any point in the graph.
- Mixed. A graph that contains both directed and undirected edges.
- Graph with loops. Graph edges that start and end at the same vertex are called loops. For example, if we are building a diagram of connections in a social network, we can use a loop to show that a user likes their own posts.
- Multigraph. If there are multiple edges between two graphs, then such a graph is called a multigraph. Such graphs are often used in transportation system diagrams when there are several different routes between cities (rail, road, and air).
An empty graph is a type of graph that has no edges. Although such a graph may contain vertices, there are no connections between them. This allows us to visualize systems in which objects do not interact with each other. For example, in the context of a social network, an empty graph might represent a person who has no contacts or communication with others. This approach allows for the visualization of isolated elements in various models and systems.
A complete graph is a structure in which every vertex is connected by an edge to every other vertex. Such a graph ideally illustrates a team in which every member knows every other member. Complete graphs are an important element of graph theory and find application in various fields, including social networks, communications, and network topology. Understanding a complete graph can help in analyzing interactions in groups and in optimizing processes related to information exchange.
A connected graph is a structure in which there is a path between every pair of vertices. This means that from any vertex, you can reach any other by following the edges of the graph. In such a graph, there are no isolated vertices or groups of vertices that have no connection with other elements of the structure. Connected graphs are an important object of study in graph theory and find application in various fields, such as computer networks, social media, and transportation systems.
A weighted graph is a type of graph in which each edge is assigned a numerical value, called a weight. Weight can reflect various characteristics, such as distance, time, cost, power, and other parameters related to connecting vertices. Weighted graphs are widely used in various fields, including graph theory, route optimization, networking, and many other areas where it is necessary to consider quantitative aspects of interactions between nodes.
There are two roads between two cities: a paved highway and a dirt road. Obviously, a car trip on the asphalt will be more comfortable and economical. Therefore, the weight of the edge representing the highway will be smaller.
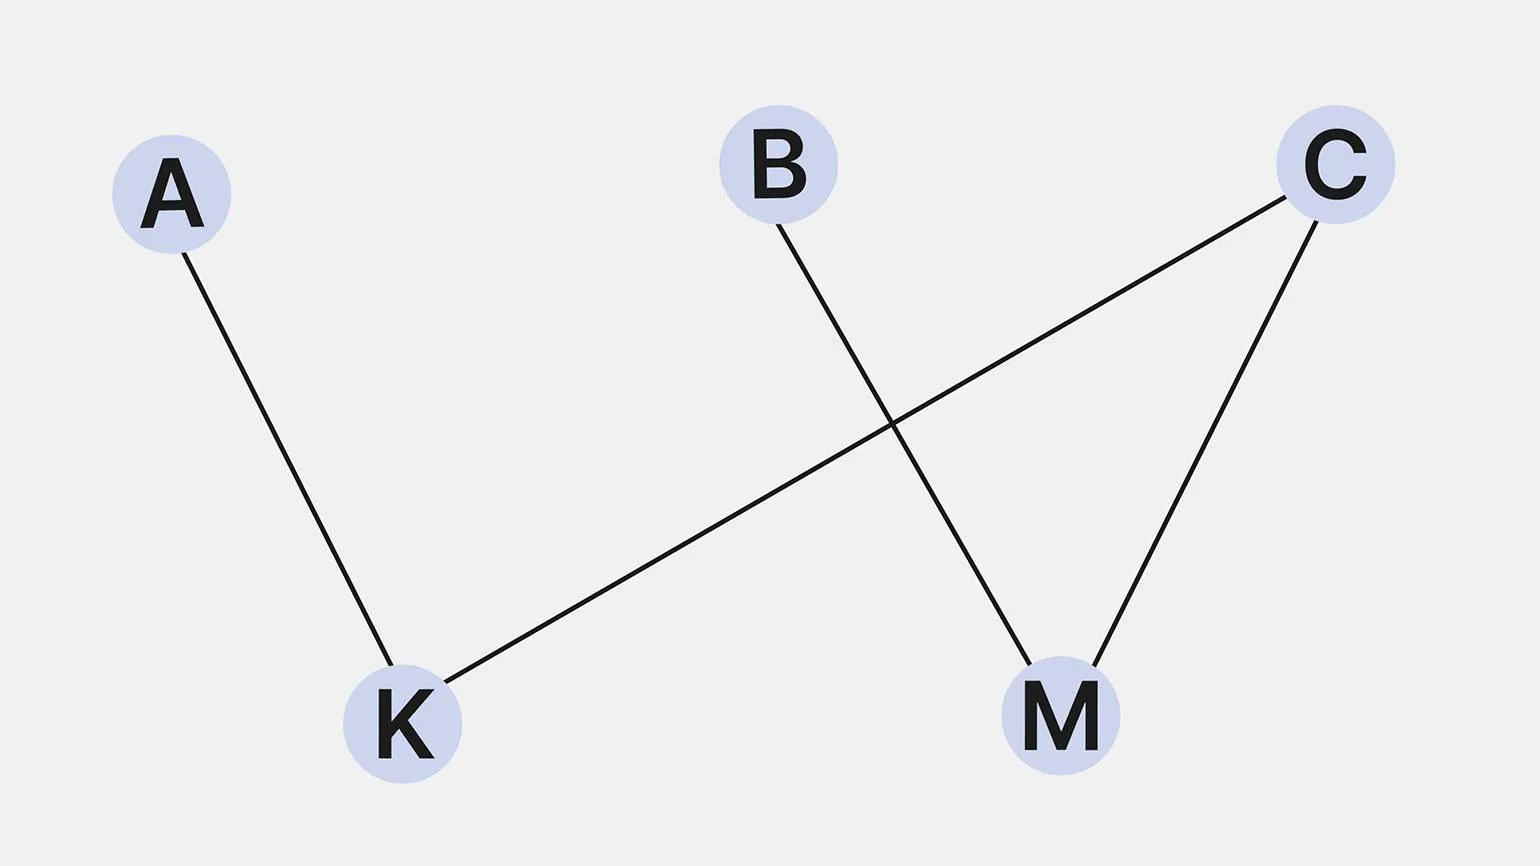
A bipartite graph is a type of graph in which all vertices can be divided into two separate groups. Importantly, edges only connect vertices from different groups, meaning there are no edges between vertices within the same group. Bipartite graphs find wide application in various fields, including graph theory, search algorithms, and network modeling.
In this situation, we can consider the interaction between a group of students and the courses they enroll in through a graph structure. The graph will include nodes representing students and courses, and edges showing which students are enrolled in which courses. This visual representation allows for a clear understanding of the connections and relationships between participants in the educational process. The graph model is an effective tool for analyzing learning preferences and organizing the educational process, helping to identify popular courses and the distribution of students among them.
- The nodes in the first group (A, B, C) are students.
- The nodes in the second group (K, M) are courses.
- The edges represent student enrollment in courses.
In the example given, student A is enrolled in course K, student B in course M, and student C in both courses. This creates a situation in which students from one set are connected to courses in another set, but the students themselves are not connected to each other. Thus, there is a clear structure of connections between students and courses, which can be illustrated as a graph where student nodes are connected to course nodes, but there are no internal connections between students.
A planar graph is a graph that can be represented on a plane, with its edges intersecting only at vertices and nowhere else. In graph theory, planar graphs are particularly important because they allow one to study the properties of graphs in two-dimensional space. The study of planar graphs is important for a variety of applications, including computer graphics, network design, and route optimization. Understanding planar graphs also involves concepts such as Kuramota's theorem and algorithms for testing graph planarity.
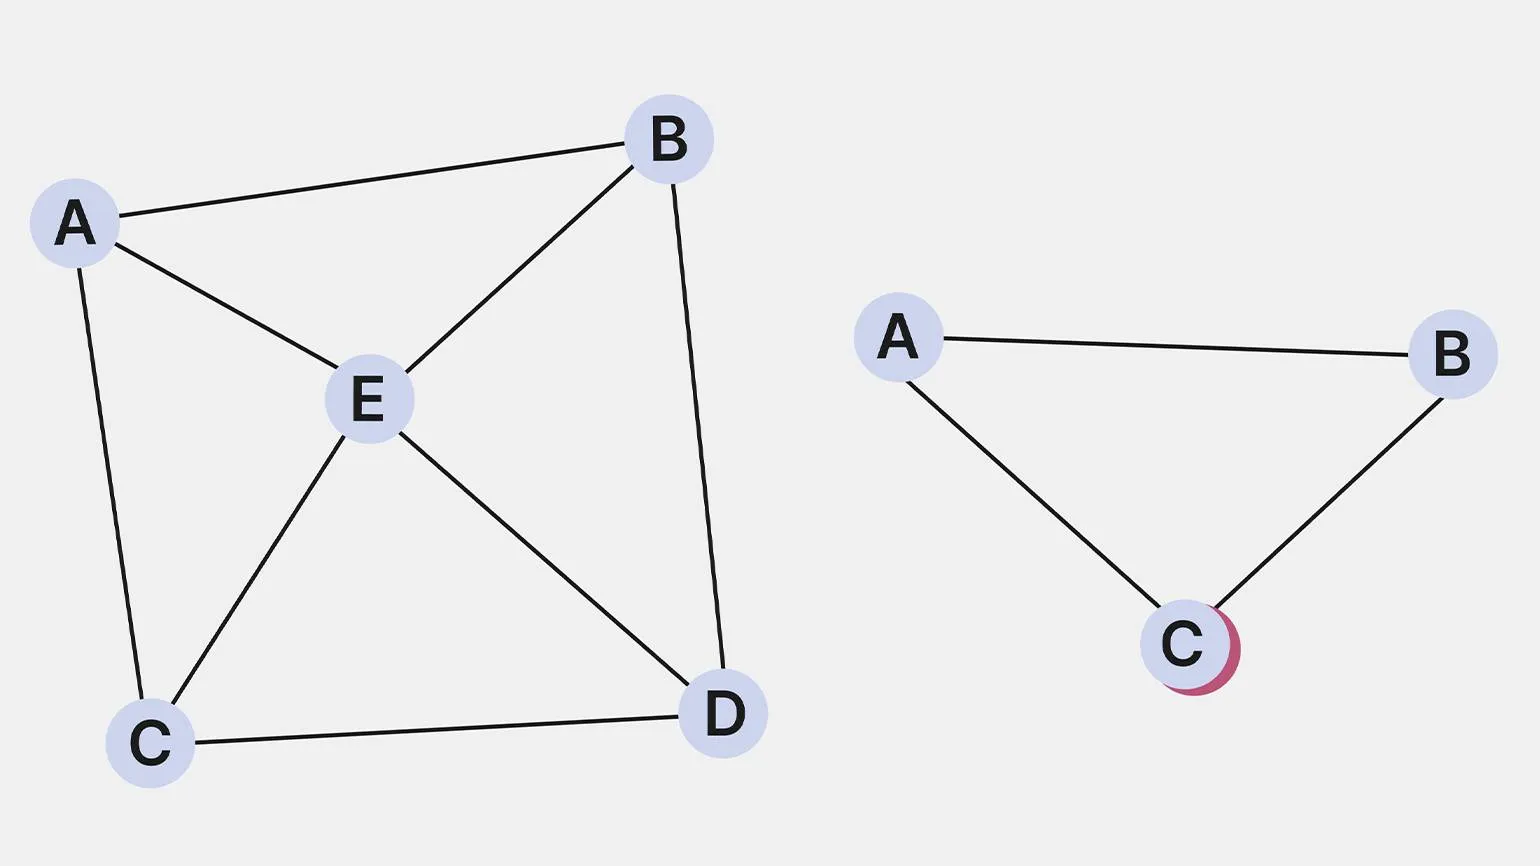
The Euler graph represents A graph has a cycle that traverses each edge exactly once and returns to the starting vertex. Additionally, there is the concept of a semi-Eulerian graph, which also traverses all edges exactly once but does not return to the starting vertex. Eulerian and semi-Eulerian graphs play an important role in graph theory and have many applications in various fields, including mathematics, computer science, and logistics. Understanding these graphs helps in solving problems related to routing and optimization. Eulerian graphs play a key role in solving route optimization problems. Their application is especially effective in developing tourist routes and planning supply chains. Using Eulerian graphs allows one to find optimal paths while minimizing time and resource costs. This makes them indispensable tools in the fields of tourism and logistics, where it is important to consider many variables to achieve maximum efficiency. The ancient mathematical problem of the Königsberg bridges has become a famous example in the history of mathematical theory. In the city of Königsberg, now Kaliningrad, seven bridges were built across the Pregel River, now called the Pregolya. The question was whether it was possible to walk across all of them without crossing each one more than once. In 1736, the great mathematician Leonhard Euler solved this problem, first using graph theory to analyze the problem. In the process, he developed the concept of cyclic graphs, which later became known as Eulerian graphs in his honor. This problem not only became the foundation for the development of graph theory but also demonstrated the importance of mathematical analysis in solving practical problems.
Walking across the bridges in Kaliningrad is impossible. If you have any doubts, come and see for yourself.
Trees in Graphs
Trees are a special type of graph that have no cycles, but for each pair of nodes there is a unique path. These data structures are essential in searching and sorting algorithms, providing efficient representation and processing of information. Due to their hierarchical structure, trees allow for optimized data access, making them indispensable in various fields such as computer science, databases, and network technologies.
Trees have a number of key properties that make them important elements of the ecosystem. Firstly, they provide oxygen through photosynthesis, which helps improve air quality. Secondly, trees play an important role in maintaining the water balance, preventing soil erosion and retaining rainwater.
Furthermore, trees provide natural shelter for many species of animals and plants, supporting biodiversity. Their root system strengthens the soil, reducing the risk of landslides and destruction. Trees also regulate microclimate by creating shade and reducing ambient temperatures.
It is important to note that trees are long-term carbon sinks, which helps combat climate change. Their wood is used in construction and manufacturing, which highlights the economic importance of trees. Overall, trees play an irreplaceable role in our world, providing both environmental and economic benefits.
- There is a connection between any two vertices.
- There is a unique path between any two vertices. This means that there cannot be two different paths connecting the same pair of vertices.
- A tree with n vertices has exactly n − 1 edges. This is a fundamental property of trees.
There are many species of trees, each designed to perform specific tasks. The diversity of trees allows them to be used in various fields, such as landscape design, construction, ecology, and horticulture. Each tree has its own unique characteristics that make it suitable for specific conditions and purposes. For example, some tree species are ideal for providing shade or wind protection, while others can be used to improve soil quality or attract wildlife. Selecting the right tree species depends on climate conditions, soil type, and the desired outcome. Proper selection and care of trees can significantly improve their performance and longevity, making them an integral part of natural and artificial landscapes.
- Rooted tree. This is a tree in which one vertex is designated as the root. In such a tree, a downward direction is defined from the root to the "leaves" (vertices without descendants). The vertices of the graph are divided into parent and child vertices. For example, if node A is a parent for B and C, then B and C are children of A.
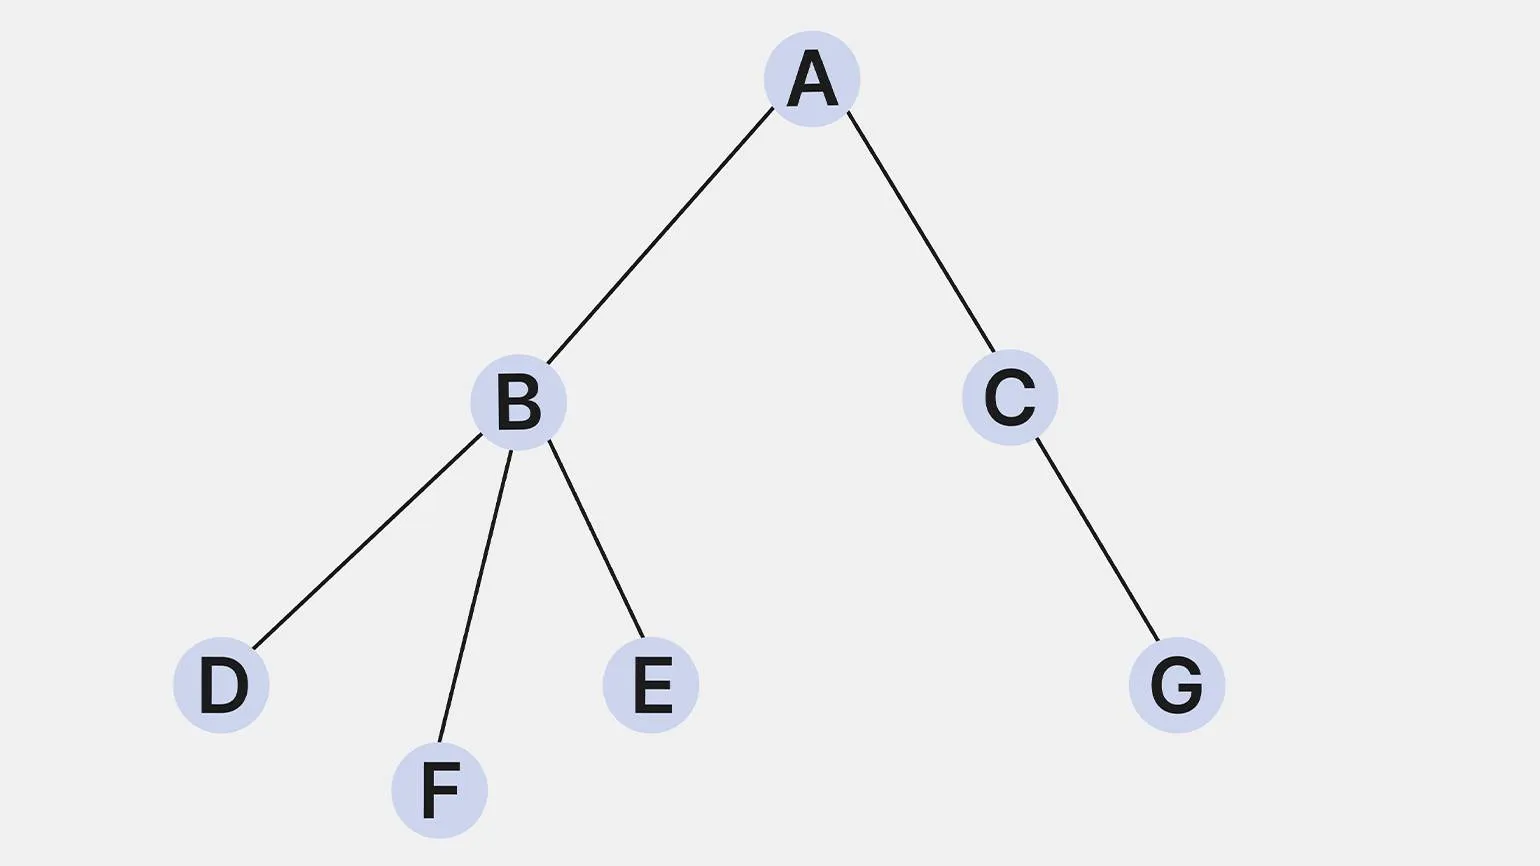
The structure of files on a computer is presented in A hierarchical tree with a root directory and subdirectories and files that are its children. This organization allows users to manage data efficiently, providing convenient file access and simplifying system navigation. The root directory serves as the starting point for all other file system elements, making the structure logical and understandable.
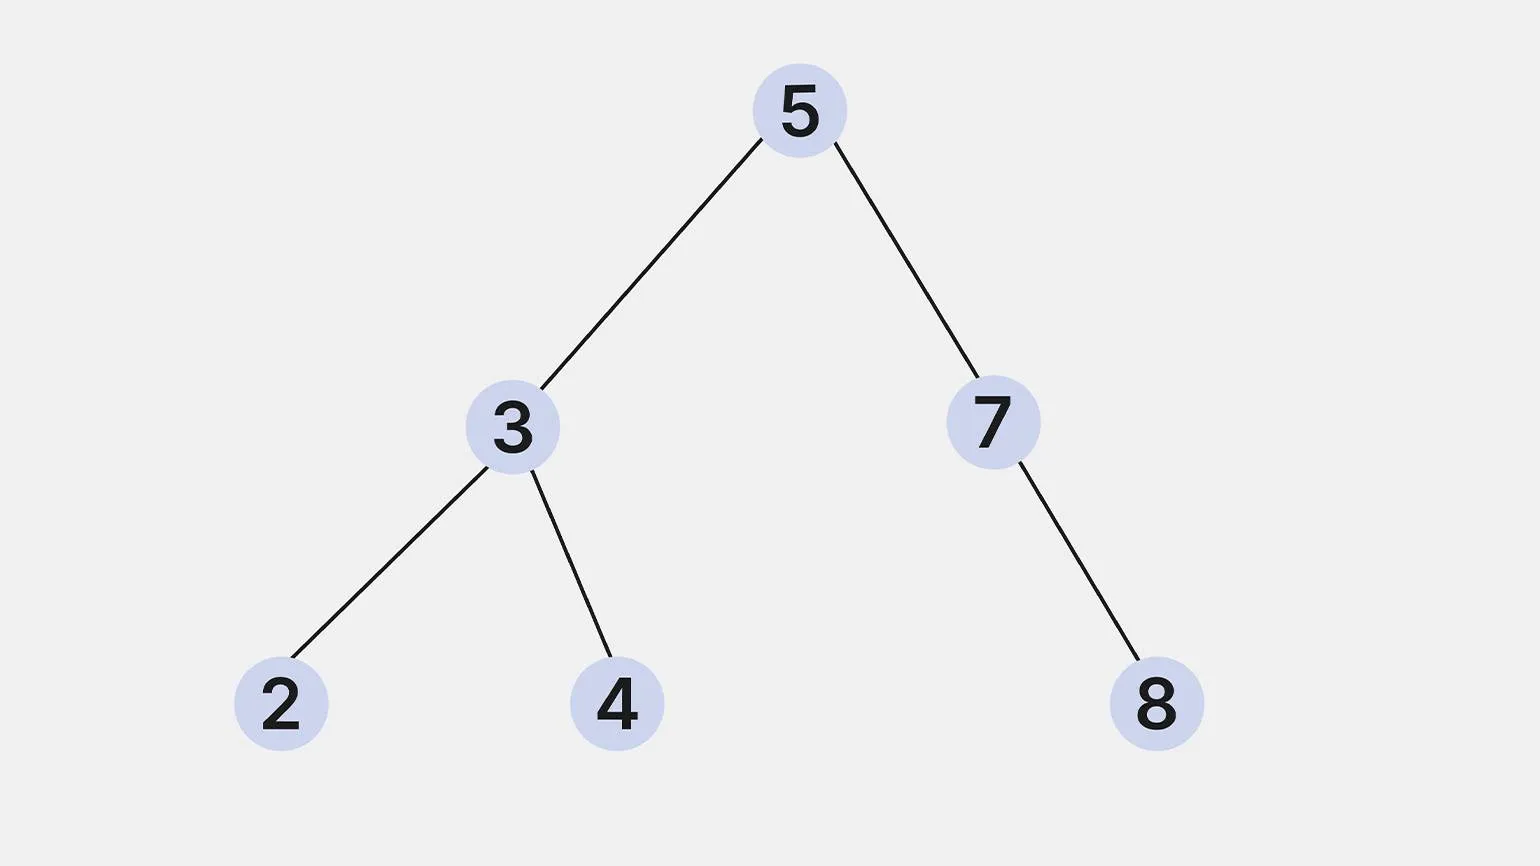
- Binary tree. A tree in which each node has no more than two descendants. Binary trees are often used to organize information retrieval.

- Binary search tree (BST). A binary tree in which the following condition is satisfied for each node: the values of all nodes in the left subtree are less than the value of the parent node, and those in the right subtree are greater than or equal to it. BST provides efficient searching, insertion, and deletion of elements.
What to remember
- A graph is a mathematical structure with which can be used to display various objects and the relationships between them. Graphs consist of vertices and the edges connecting them.
- Some graphs, such as Euler graphs or trees, have unique properties suitable for solving specific problems.
- With the help of graphs, you can find optimal routes, create maps of social connections, build diagrams of equipment in a local network, and organize information searches.
Mathematics for Data Science
You will understand the basic sections of mathematics, study the methods of statistics and probability theory, understand the basics of machine learning and can start a career in Data Science - IT companies around the world are looking for such specialists.
Find out more