
Table of Contents:
- 1. Basic Concepts of Descriptive Statistics
- 2. Understanding Data Distributions
- 3. Sampling: The Art of Choice
- 4. Understanding Bias in Modeling
- What is Variance and Its Importance in Statistics
- Understanding Variance: How It Affects Data Analysis
- 6. The Bias-Variance Dilemma in Machine Learning
- 7. Correlation: Understanding and Application

Python Course: 4 Projects for Your Portfolio
Learn More1. Basic Concepts of Descriptive Statistics
Descriptive statistics are an important tool in data analysis because they provide a detailed description and summary of the characteristics of data sets. Unlike predictive statistics, the main goal of descriptive statistics is to present data in a clear and accessible form. This allows researchers and analysts to better understand the structure and features of the data, and to identify patterns and trends. Descriptive statistics include measures such as the mean, median, mode, variance, and standard deviation, which help characterize the distribution of data and its characteristics. Using descriptive statistics is the first step in analysis, allowing you to prepare data for further exploration and interpretation.
The main indicators used in descriptive statistics include key measures of central tendency. These measures allow you to summarize the data and identify its main characteristics. These include the mean, median, and mode, which help analyze the distribution and behavior of the data under study. Correct use of these measures allows you to more accurately interpret the results and draw informed conclusions based on statistical information.
- Mean: Calculated as the arithmetic mean, which is the sum of all the values divided by their number. This allows you to get an overall picture of the data.
- Median: To find the median, you need to sort the data in ascending order and find the middle value. This value divides the data set into two equal parts.
- Mode: Defined as the value that occurs most often in the data set. The mode is easy to remember: it represents the "most popular" value.

We recommend watching an informative video about the mean, median and mode on the Khan Academy platform. This educational resource provides clear and accessible explanations in Russian, making learning statistics more engaging and effective. Khan Academy will help you gain a deeper understanding of these important statistical concepts and apply them in your practice.
In addition to the three main measures, it is important to consider other statistical metrics, including measures of dispersion. One key measure is variance, which helps to analyze in more depth how much data varies within a data set. Understanding dispersion allows researchers and analysts to better interpret data, identify outliers, and draw informed conclusions. Analyzing variance can also be useful for assessing the stability and reliability of data across various studies and projects.
2. Understanding Data Distribution
Data distribution is an important aspect of big data analysis, allowing you to identify relationships between different quantities. Just as a person's age, gender, and even profession can be determined by their appearance, data distribution helps assess the structure and characteristics of information arrays. Understanding data distributions provides analysts with tools for deeper analysis and interpretation of results, which in turn facilitates informed decision-making in various fields.
The term "distribution" originates in probability theory, where each event is analyzed in terms of its likelihood of occurrence. Even if events occur with varying frequencies, they follow a certain distribution that organizes these probabilities. Distributions allow us to explore patterns in random phenomena and predict likely outcomes based on available data. Understanding distributions is a key element in statistics and probabilistic models, making it an important tool for data analysis and informed decision-making.
In the context of data science, a distribution represents a law of relationships between quantities. It helps identify the processes underlying the data and assess its completeness and quality. Understanding distributions is critical for data analysis and model building. If you'd like to deepen your understanding of the mathematical foundations of data science, we recommend checking out our article on mathematics for beginners, where you'll find useful information and examples.
The normal distribution, also known as the Gaussian distribution, is one of the most well-known types of statistical distributions. It describes situations in which the final result is the sum of many independent random variables, each of which has a negligible effect on the overall result. The normal distribution plays a key role in statistics and probability calculations, as many natural and social phenomena obey its laws. Understanding the normal distribution is important for data analysis and the application of statistical methods because it allows one to draw conclusions about large samples based on a limited amount of information.

The normal distribution is widely used in various fields, from the magnitude of measurement errors in physics to biological parameters such as the length of claws and teeth. This distribution is one of the most common in nature, which confirms its significance and versatility. The normal distribution plays a key role in statistics and scientific research, as many natural phenomena obey this regular distribution. Understanding the normal distribution is important for data analysis, which makes it an indispensable tool in scientific and practical activities.
The Poisson distribution is one of the most common statistical distributions used to model the number of events occurring in a given time interval. This distribution is especially relevant when events occur independently of each other and with constant intensity. For example, the Poisson distribution is often used in fields such as probability theory, statistics, and various applied sciences, including economics and biology. It allows for the effective analysis of rare events, making it an indispensable tool for researchers and specialists.
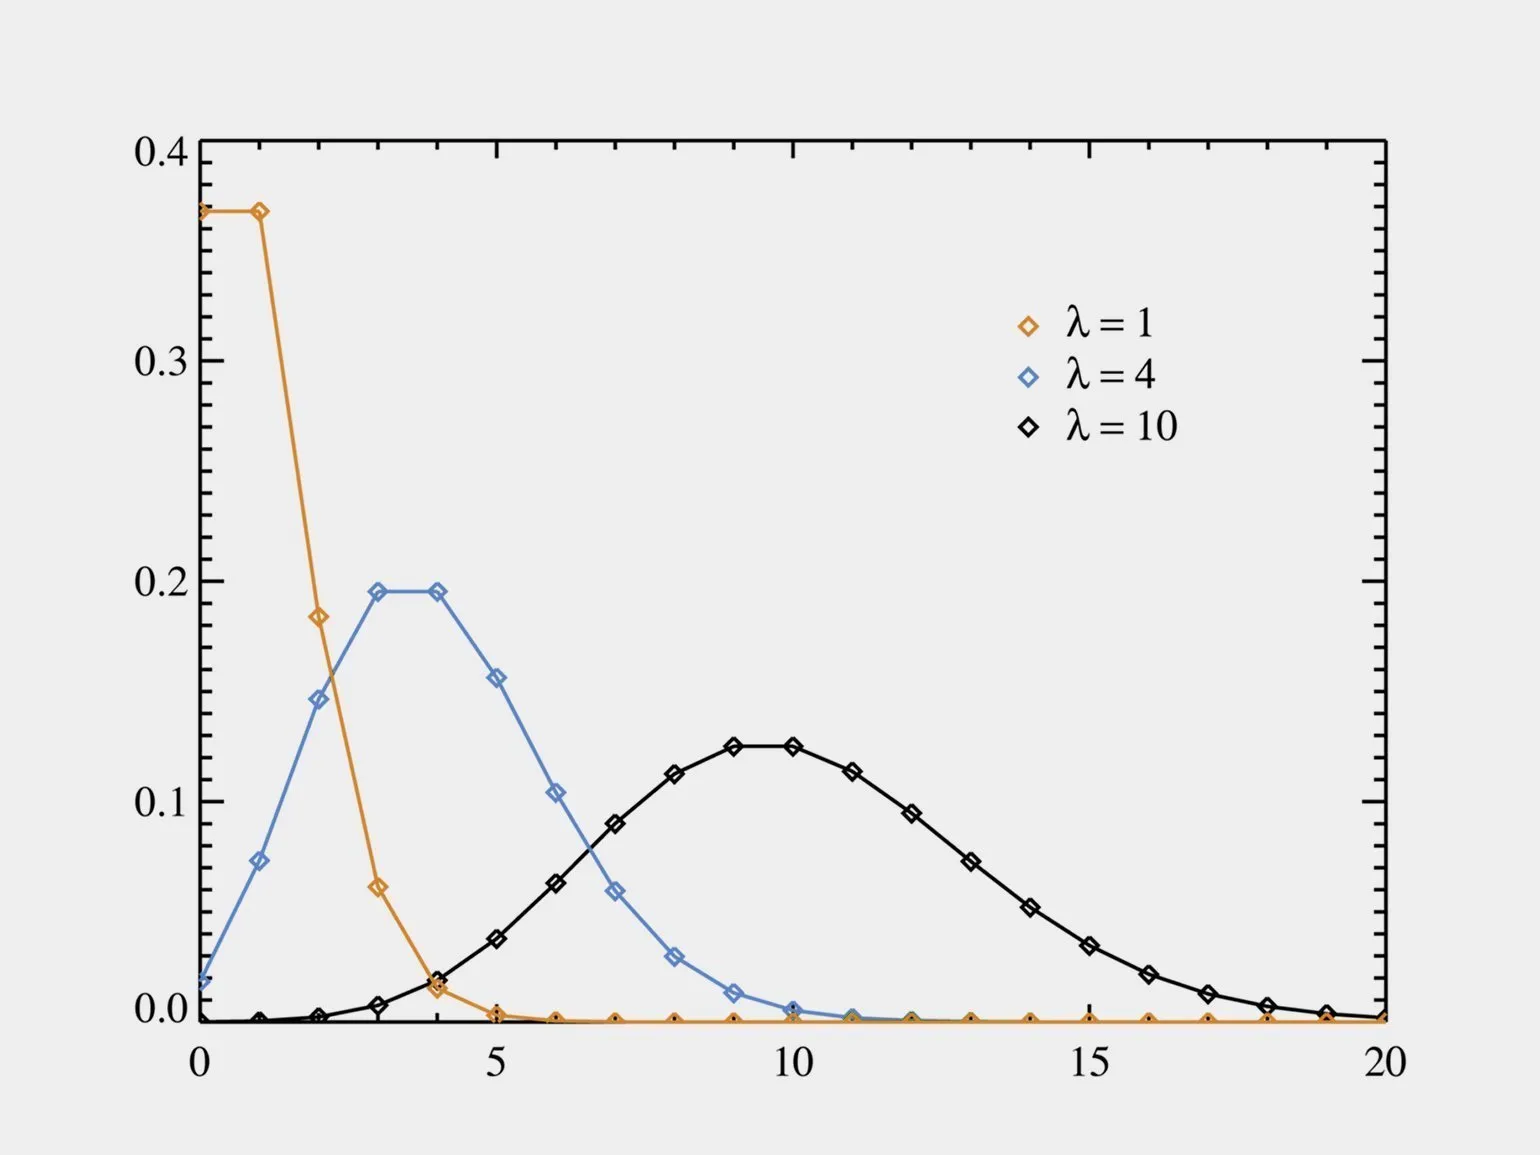
The Poisson distribution is widely used in a variety of fields, including counting the number of people in shopping malls, analyzing sports performance, and studying the growth of bacterial colonies. This statistical model helps investigate rare events and predict the probabilities of their occurrence in a given period of time. Due to its versatility, the Poisson distribution finds application in fields such as marketing, medicine, and ecology, allowing specialists to effectively process and analyze data.
There are also less common distributions, such as the Wigner, Weibull, and Cauchy distributions. These distributions may be relevant in specialized fields, including quantum physics. However, it is important for data scientists to understand key distributions, their graphs, and parameters. Knowledge of these aspects significantly improves data analysis and facilitates a more accurate interpretation of the results. Understanding underlying distributions helps in choosing the right statistical analysis and modeling methods, a necessary skill in data science.
3. Sampling: The Art of Choice
In today's world, where data plays a crucial role in decision making, understanding sampling is becoming increasingly important. For example, to determine the average muzzle width of domestic cats in our country, it is impossible to measure all the animals due to time and resource constraints. In such cases, it is necessary to use sampling—measure the muzzles of a certain number of cats and draw informed conclusions based on this data. Correctly conducted sampling allows you to obtain accurate and reliable results that can be used for analysis and decision-making in various fields.

This approach raises many questions that require careful analysis.
- What number and which specific cats should be selected for measurement?
- Why should these particular animals be chosen and not others?
- What guarantees exist that the obtained average value truly reflects the muzzle width of all cats in Russia?
Sampling is an important set of statistical methods that allows for the effective study of the characteristics of a general population, for example, all cats in a country. Properly organized sampling helps to form a sample that most accurately reflects the diversity and characteristics of a given population. This is critical to obtaining reliable data and conclusions, which in turn contributes to a deeper understanding of the cat population and their behavior.

When conducting research on When studying cats, it's important to remember that simply measuring randomly selected individuals doesn't provide objective results. To obtain reliable data, it's essential to use a representative sample that reflects the overall population. This approach allows for informed conclusions and accurate analytical data on various cat characteristics. A relevant sample is key to successful research and ensuring the reliability of results. Statistics and cats have an interesting relationship. With the publication of Vladimir Saveliev's book on statistics, many have begun to connect the two topics. The book offers a unique perspective on statistics through the lens of cats, making it particularly appealing to anyone interested in this field. We recommend reading Saveliev's work to gain a deeper understanding of how statistical data can be connected to everyday life, including that of our furry friends. Sampling methods in data science are key tools for creating, preparing, and evaluating datasets. They help ensure that the data is structured and accurately reflects reality. Proper sampling avoids bias and ensures high-quality analysis, which in turn leads to more accurate conclusions and forecasts. Effective sampling techniques help researchers and analysts obtain representative samples, which is critical for analyzing large volumes of data and making informed decisions.
4. Understanding Bias in Modeling
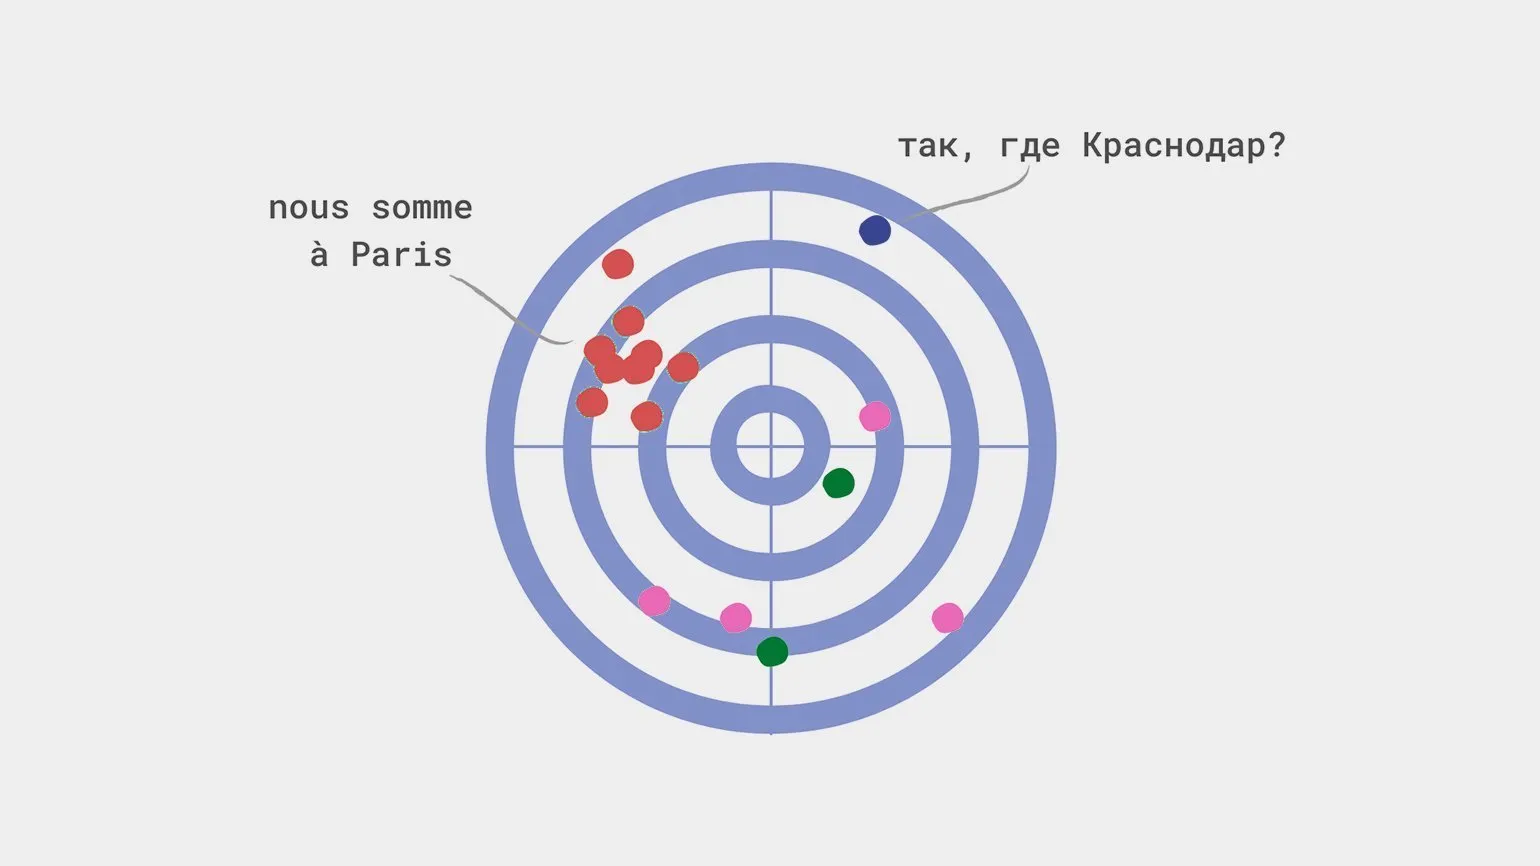
Bias in a machine learning model is a critical aspect that can significantly impact the accuracy of predictions. It occurs when the algorithm incorrectly estimates certain parameters, which can lead to incorrect conclusions. For example, if a tourism model offers all residents of Krasnodar trips exclusively to Paris, ignoring their individual preferences and financial capabilities, this indicates bias. In this case, the model overestimates the "City of Residence" parameter, which can ultimately lead to user dissatisfaction and reduced service effectiveness. Proper tuning and estimation of model parameters are essential for achieving more accurate and personalized results.
Data bias can be caused by various factors. The main causes include errors in data collection, incorrect data processing, the influence of external factors, and changes in measurement methods. The human factor, which can lead to data distortion, should also be taken into account. Understanding the causes of data bias is crucial for analyzing and interpreting results, as it allows you to avoid incorrect conclusions and improve the quality of decisions.
- Incorrect data collection: only certain groups are included in the sample, for example, residents of Krasnodar who love Paris.
- Errors in forming the training set.
- Insufficient precision of error measurement.
Incorrect data collection can cause systematic errors in the selection of information. For example, in the last century, there was an opinion that blue galaxies predominate in space. This opinion arose due to the peculiarities of photographic film's sensitivity to the blue part of the spectrum, which distorted reality. Proper data collection and analysis are key to obtaining accurate scientific conclusions and understanding space objects.
One common error, called the "sharpshooter's fallacy," occurs when a data sample is formed solely on the basis of similar results. This can be compared to a shooter drawing a target around the spots they hit, rather than assessing the true state of affairs. This approach biases the analysis and can lead to incorrect conclusions. It's important to consider data diversity and avoid sample bias to obtain more accurate and reliable results.
The causes of data bias are so varied that the famous writer Mark Twain remarked, "There are three kinds of lies: lies, damned lies, and statistics." Key factors contributing to bias include selective sampling, biased interpretation of data, and distortions in data collection. These aspects can significantly influence conclusions and decisions based on statistical data. Understanding the causes of bias is critical to improving the accuracy of your analysis and ensuring the reliability of your results.
- Low/high base effect: if you report the lowest profit margin on your financial statements, any other metric will look like a success.
- Time period reduction: to prove the ineffectiveness of an advertising campaign, simply select a period when the money has already been spent and there are no results.
- Excluding participants from the sample: if you are conducting a weight loss study, you can exclude those who stopped the method to improve the results.
- A classic case: “The survey showed that 100% of the population uses the Internet.”
Bias errors are difficult to detect using statistical methods, so it is critical to prevent them during the preparation stage for data collection.
Once the data has already been collected and structured, it is important to ask yourself a few key questions. First, you need to find out if your data is biased. In most cases, it really can be biased. The second question is the direction and cause of the bias. The third question is whether it is tolerable. Analyzing these aspects will help you better understand the quality of your data and its impact on your conclusions.
For a deeper understanding of bias-mitigation methods and the importance of proper data sampling, it is important to study research on reputable platforms such as Towards Data Science and KDnuggets. These resources provide valuable materials and up-to-date information on how to avoid data bias and improve the quality of analytics. Referring to these sources will help deepen your knowledge and skills in data analysis and machine learning, which is essential for the successful completion of projects in this field.
What is Variance and Its Importance in Statistics
Variance is an important concept in statistics and machine learning that indicates the degree of spread of values relative to their mathematical expectation. It allows you to assess the extent to which model results or financial returns deviate from the expected value. Understanding variance is critical to analyzing and optimizing analytical models because it helps evaluate their accuracy and reliability. A decrease in variance can indicate increased stability of predictions, which is especially relevant in the context of business decision making and the development of effective algorithms.
Variance, as a measure of spread, plays a key role in analyzing data variation. It allows one to assess the extent to which values in a data set deviate from the mean. The mathematical expectation, which can be theoretically determined for various statistical distributions, is typically used as a baseline value. Most often, the simple arithmetic mean serves as this benchmark. Understanding variance and its calculation is essential for statistical analysis because it helps identify the degree of variability in data and make informed decisions based on the results.
The mathematical expectation of a standard die roll can be calculated as follows: (1 + 2 + 3 + 4 + 5 + 6) / 6 = 21/6 = 3.5. This value represents the average result that can be expected over a large number of die rolls. Therefore, expected value is an important concept in probability theory and helps predict the outcomes of random events. Imagine a shooting range where a shooter aims to hit the center of a target. A shot in the center earns a maximum score of 10 points, while a shot away from the center lowers the score to 1 point at the edge of the target. Each shot can be viewed as a random value between 1 and 10, clearly demonstrating the principle of variance. This situation illustrates how random factors influence results, as well as the importance of precision and control in achieving the best possible score. Understanding variance can be useful in a variety of fields, from statistics to decision making under uncertainty.
A riddled target provides a visual example of the distribution of shooting results. In this context, variance can be thought of as the reciprocal of shot concentration. High concentration, meaning many hits on the same spot, corresponds to low variance. Conversely, low concentration, characterizing the dispersion of hits, indicates high variance. Understanding this relationship is important for analyzing shooting results and improving skills.
Understanding Variance: How It Affects Data Analysis
Variance is an important metric that not only helps assess the spread of data but also forms the basis for more sophisticated statistical methods, such as analysis of variance and constructing confidence intervals. The use of variance in data analytics enables researchers and business analysts to make more accurate inferences and predictions. Understanding variance helps improve the quality of analysis and increase the effectiveness of data-driven decision-making.
6. The Bias-Variance Dilemma in Machine Learning
In machine learning, bias and variance are the primary factors affecting a model's overall prediction error. While optimal results minimize both bias and variance, a practical problem arises: reducing one often increases the other. This contradiction requires careful consideration when developing and tuning models to achieve the best possible prediction results. Understanding the relationship between bias and variance can help machine learning practitioners optimize their models and improve their performance.

Training a model represents is the process of developing a function whose graph accurately reflects the data from the training set. This enables the model to effectively predict outcomes based on known data. Correctly interpreting and adapting the function to the training data are key aspects of ensuring high prediction accuracy.
If the function is too complex and overloaded with details, this can negatively impact its predictive ability on new data, ultimately leading to bias. Understanding this problem is important for developing effective models, as simplifying the function can improve its generalization ability and improve the quality of predictions.

Using different training sets or datasets can cause significant fluctuations in predictions, indicating high levels of variance. This highlights the importance of selecting high-quality and representative data for training models to minimize uncertainty and improve prediction accuracy. Proper training set design leads to more stable and reliable results in machine learning.
Complex models typically have low bias, but they are more vulnerable to noise and variability in new data, which can lead to instability in their predictions. For example, if a sniper adjusts his scope based on irrelevant factors, such as the color of the target, this will negatively impact his accuracy in different conditions. This highlights the importance of considering relevant variables when building predictive models to ensure their robustness and accuracy in changing situations.
Simple models can miss key parameters, which, despite their ability to make accurate predictions, leads to frequent errors. This is analogous to a sniper who fails to account for wind or distance to the target and, as a result, misses the target. It is important to understand that in order to achieve high accuracy and reliability of forecasting, it is necessary to take into account all significant factors.
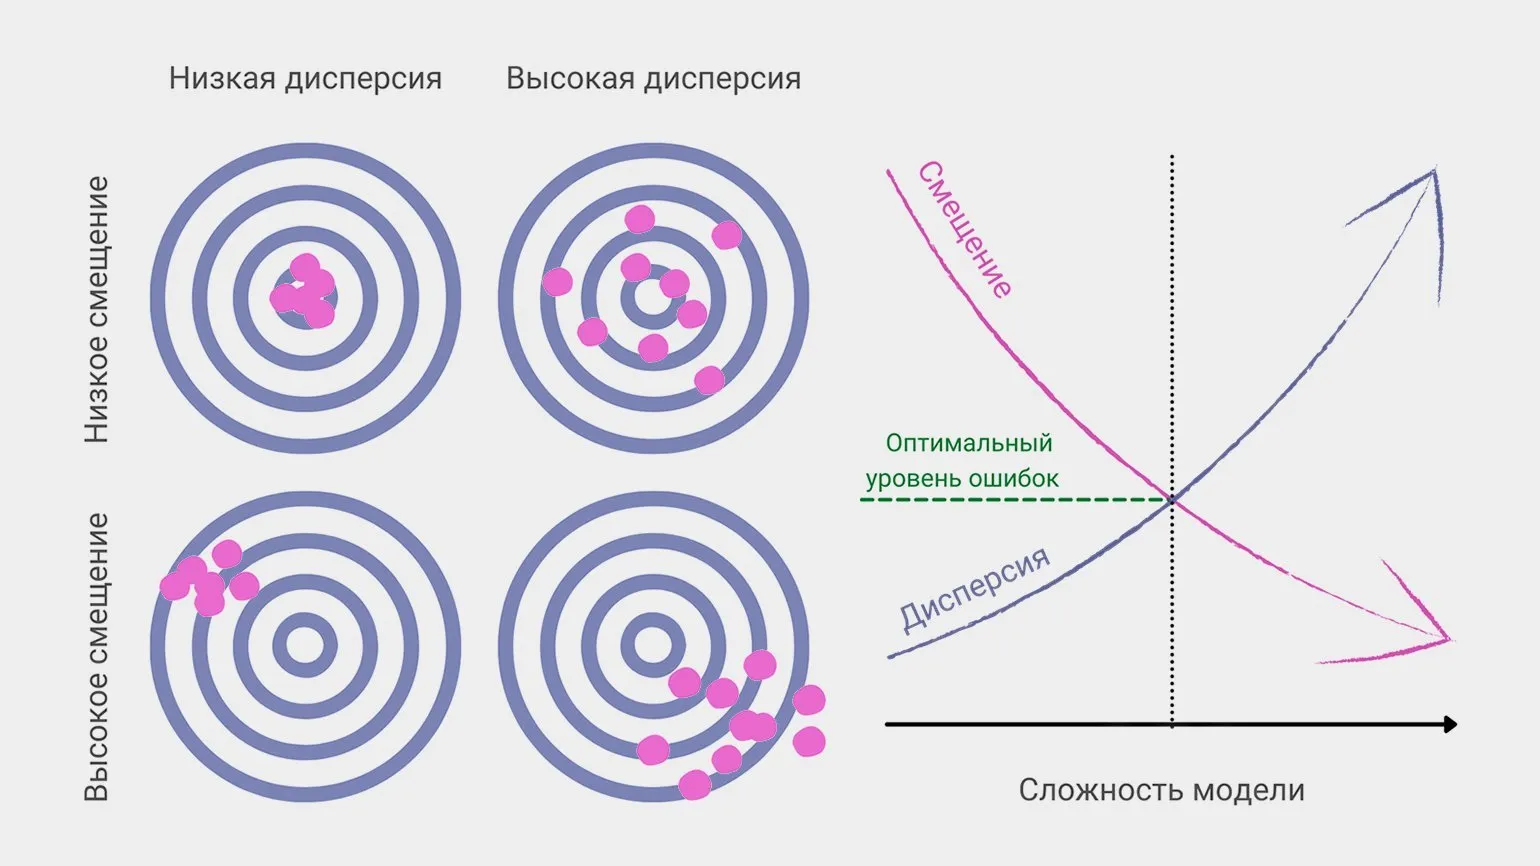
A data scientist constantly works to achieve the optimal balance between bias and variance in order to minimize the overall prediction error. This requires careful model tuning and a deep understanding of data characteristics. Effectively managing bias and variance improves the quality of predictions and increases the accuracy of analytical inferences.
This dilemma extends beyond statistics and machine learning. A 2009 study showed that people often rely on the "high bias + low variance" heuristic: we may make mistakes, but we do so with a high degree of confidence. This phenomenon illustrates how confidence in one's conclusions can be misleading and does not always correlate with actual accuracy. Understanding such psychological mechanisms is important for improving data analysis and decision making, especially in areas where trust in results is critical.
These observations may prove useful to developers seeking to create artificial intelligence capable of making more human-like decisions and acting on emotional and social factors. Understanding these aspects will help improve user interaction with AI and increase its effectiveness in various fields.
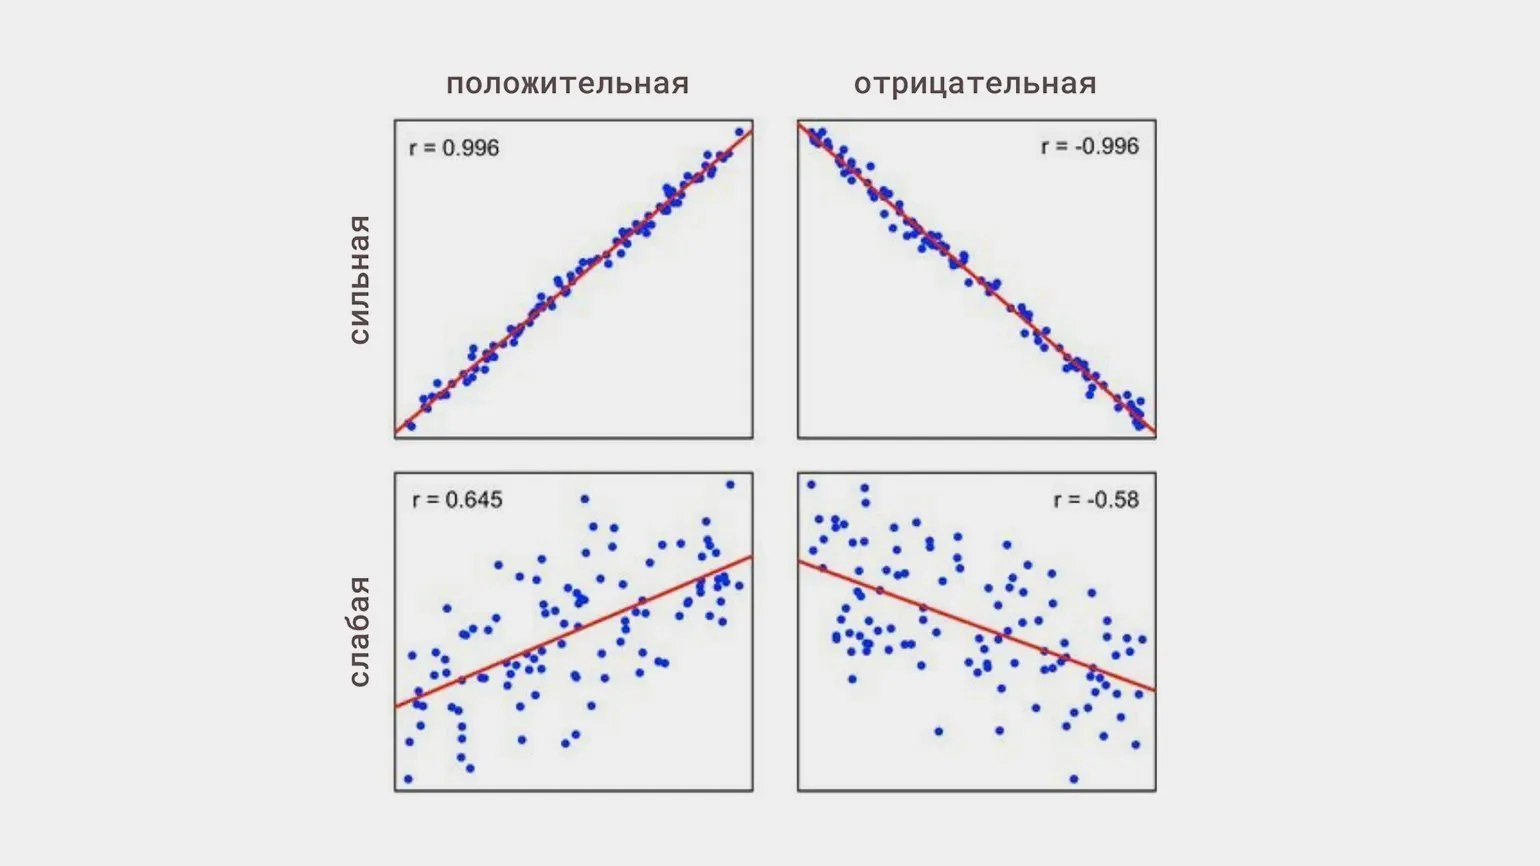
7. Correlation: Understanding and Application
Correlation is a statistical phenomenon in which a relationship is observed between changes in one variable and changes in another. However, it is worth emphasizing that the presence of correlation does not mean that one variable causes changes in the other. This principle is key when analyzing data and interpreting results. Understanding correlation and its difference from causality is important for correctly assessing relationships and making informed decisions based on statistics.
Linear correlation is a relationship between two variables in which changes in one variable proportionally affect changes in the other. Linear correlation can be positive, when an increase in one variable is accompanied by an increase in the other, or negative, when an increase in one variable leads to a decrease in the other. Understanding linear correlation is important for data analysis, as it allows you to identify and quantify relationships between variables. Linear correlation is used in a variety of fields, such as statistics, economics, and science, making it an important tool for researchers and analysts.
- positive — both values increase or decrease simultaneously;
- negative — when one variable increases, the other decreases;
- strong or weak — regardless of the direction of the relationship.
Correlation analysis is a method used to study the statistical relationship between variables. Its main goal is to assess the degree of relationship between variables, which helps determine which ones should be included in the model and which should not. This analysis can identify both positive and negative correlations, which plays an important role in building effective statistical models and forecasting. Correlation analysis is a key tool in a variety of fields, including economics, sociology, and medicine, as it helps researchers and analysts better understand the relationships between different factors.
It is important to note that correlation does not always indicate causation. Even if two indicators show a high correlation, this does not necessarily mean they are related. A more in-depth analysis is necessary to establish the true causes of data variations and avoid false conclusions.
The Spurious Correlations project is a unique platform that visualizes graphs demonstrating correlations between completely unrelated statistical data. For example, it illustrates the relationship between the number of drownings in home pools and the number of Nicolas Cage films. Such examples highlight the importance of critical thinking in data analysis and caution against drawing unfounded conclusions based on statistics. The ability to distinguish between true correlations and coincidences is essential in research and decision making. The project raises awareness of statistical tricks and helps audiences better understand how to interpret data in today's world.

Ongoing data analysis helps prevent deep correlation syndrome (DCS) and deepens understanding of statistical relationships. Regularly consulting statistical information helps identify real trends and avoid false conclusions, which is especially important for researchers and analysts. This helps make more informed decisions based on factual data rather than speculation.
Python developer: 3 projects for a successful start
Want to become a Python developer? Learn how to create 3 portfolio projects and get help with your job search!
Learn more